A nature-based tourism ecosystem service account is a method of accounting for the economic, social and environmental contributions of nature-based tourism within an ecosystem. Nature-based tourism, also known as ecotourism, involves travel to natural areas to experience and appreciate nature, wildlife and cultural heritage.
The nature-based tourism service account is created in three steps: (i) collect tourism statistics, (ii) isolate the ecosystem contribution (nature visits), (iii) attribute to the ecosystem types.
The latter step is done on a Recreation Potential Map (RPM), which in the INCA tool is generated by the Joint Research Center based on a specific model.
In PEOPLE-EA three workflows were developed to enhance the dynamics of the RPM maps (dRPM) using more EO data as is:
- Forest loss, which decreases the recreation potential, based on the Global Forest Change dataset providing annual loss
- Water quality, to fill gaps in the current map, based on the Trophic State Index from the Copernicus Land Monitoring Service Lake Water Quality (100m and 300m) and Chlorophyll-a concentrations from the Copernicus Marine Environment Monitoring Service (HROC for North-West Shelf).
- Green leisure in cities, using the Copernicus High Resolution Vegetation Phenology and Productivity dataset.
A dynamic RPM (dRPM) map was generated for the year 2021 and 2022 and applied to generate the Nature Based Tourism ecosystem service account (supply and use side) through the INCA tool.
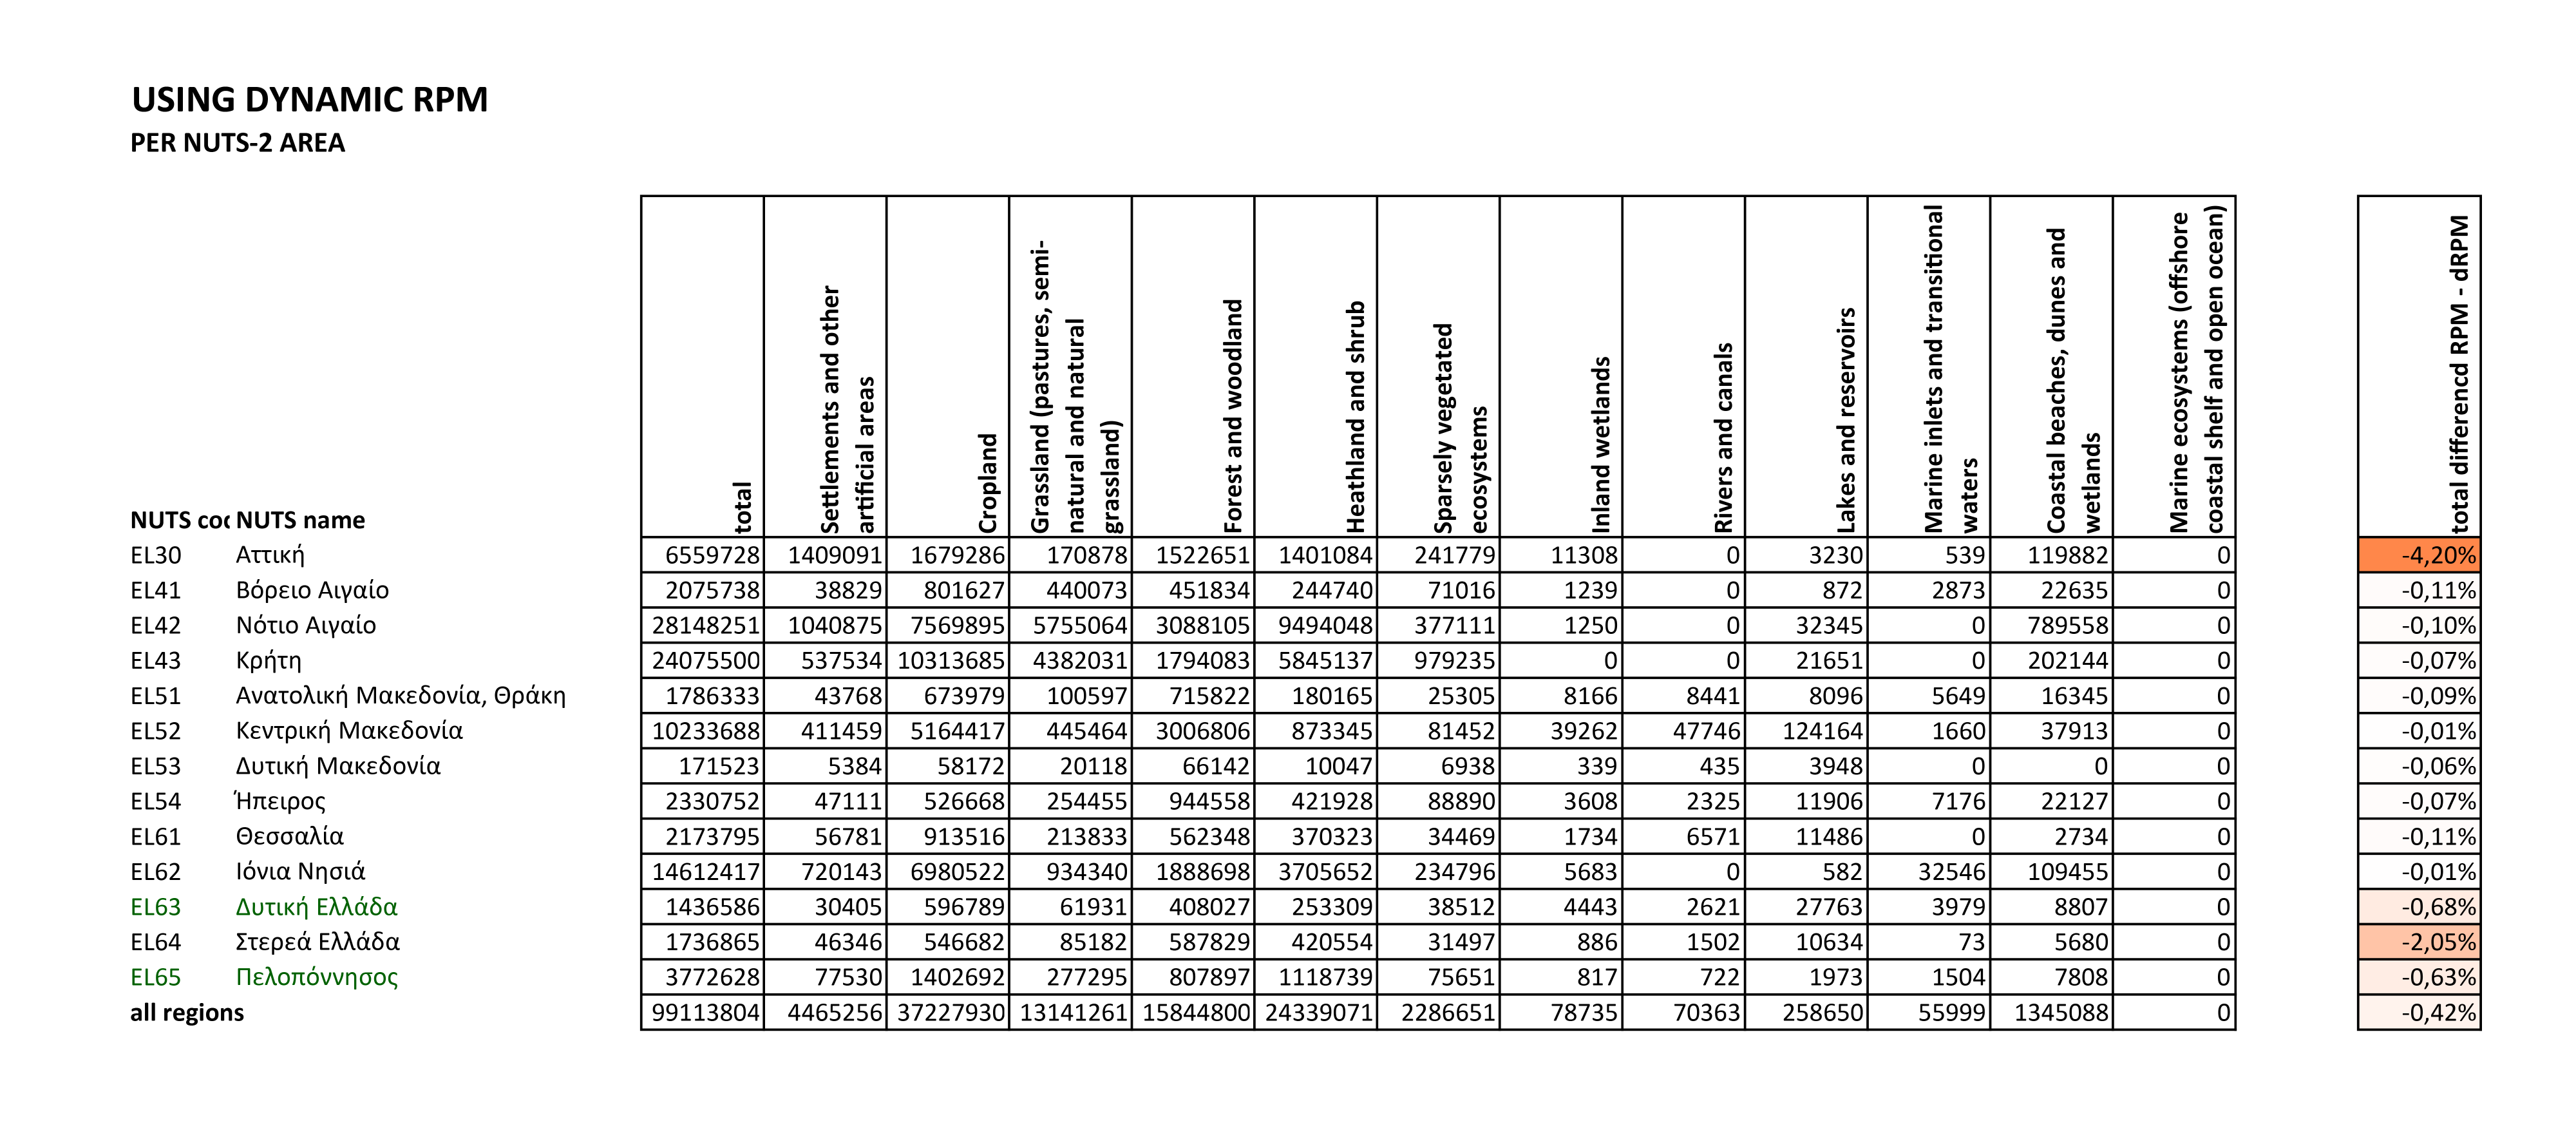
Greece

The supply side of the Nature Based Tourism ecosystem service shows a decrease of up to 4% (Attica) and up to 2% in Central Greece. The decrease is shown by lower values in the forest and woodland ecosystem type when including the forest loss (mainly fires). The other ecosystem types remain rather stable and the impact of the green leisure in cities is almost neglectable.
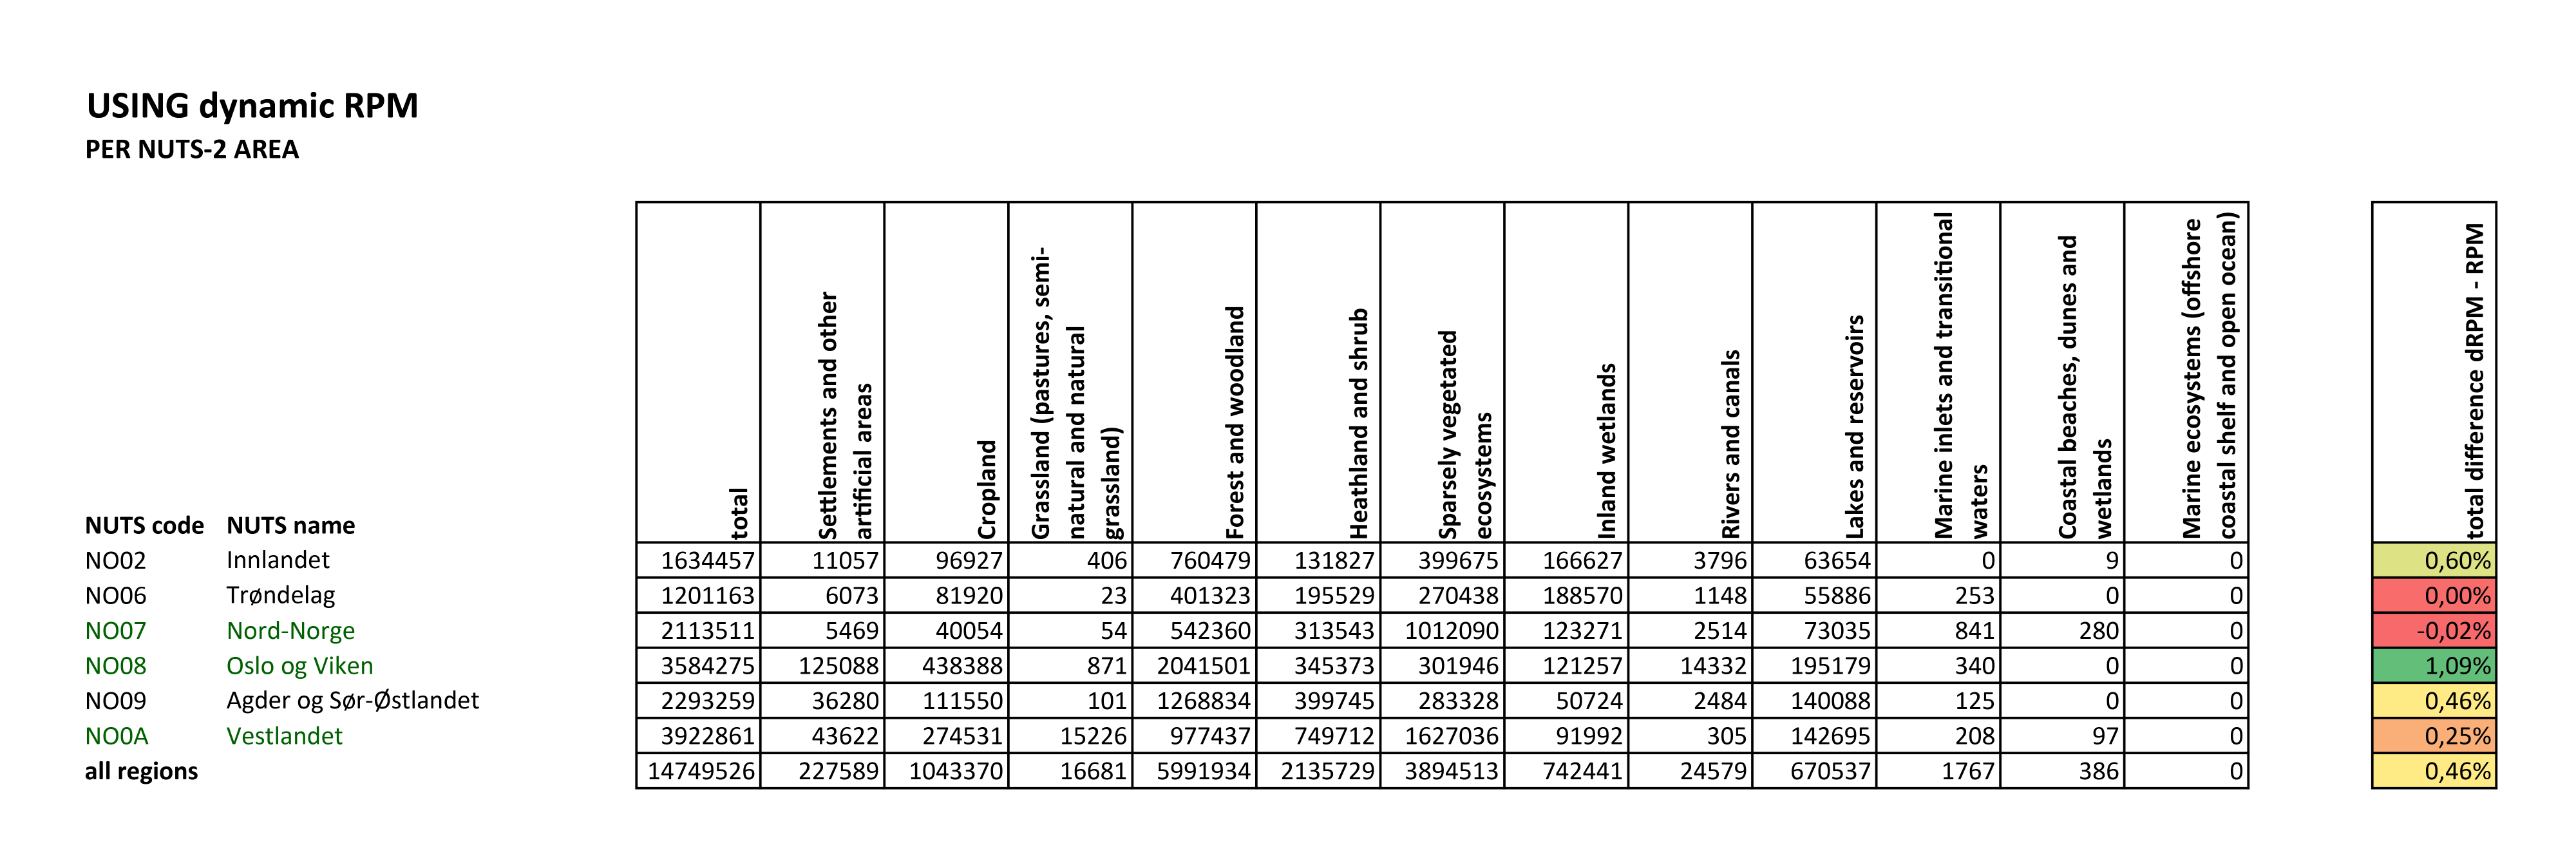
Norway

The supply side increases with 0.5% in value, mainly in the ecosystem type Rivers and Canals, by integrating more recent data on water quality. The marine inlets and transitional water show a very limited increase in value.
The highest increase can be noticed in Oslo og Viken, being the area with the most dense population.
